The question being asked…
Sep 08, 2025
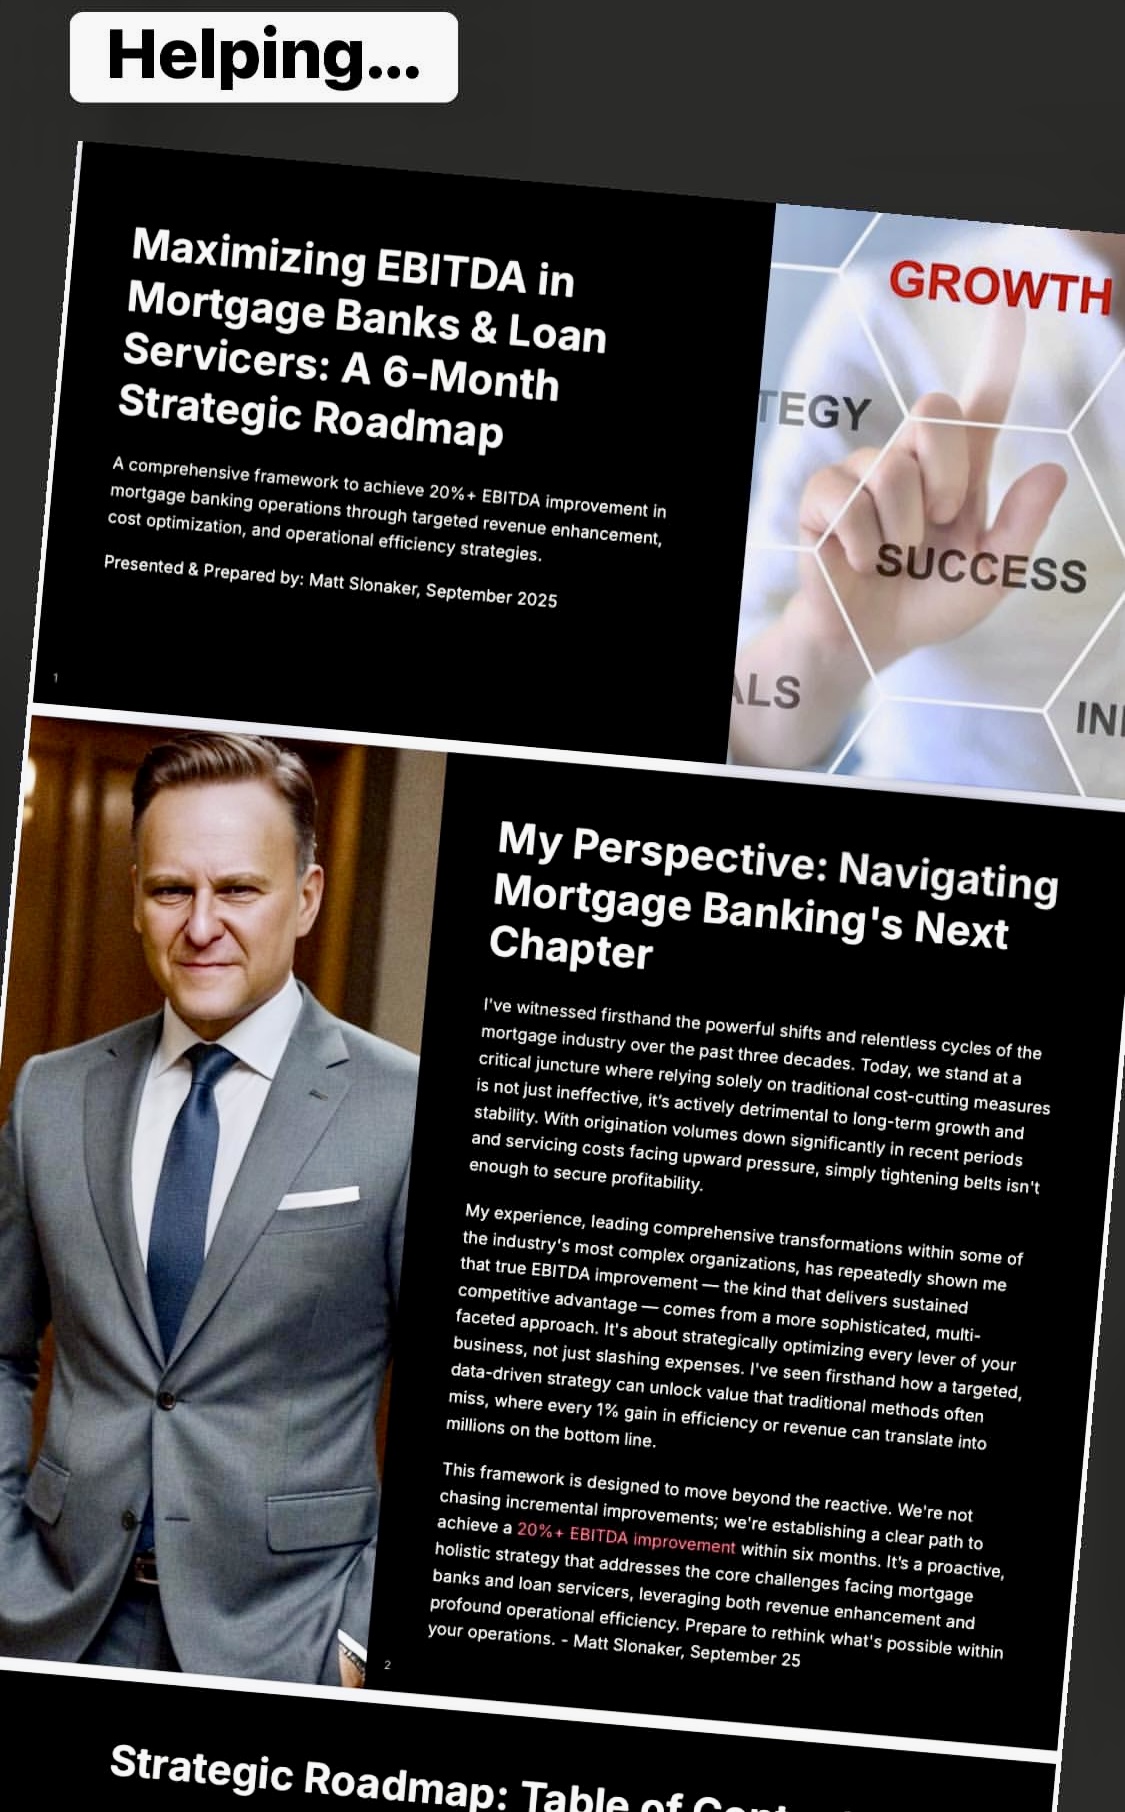
Navigating the Mortgage Industry’s Next Chapter: A 6-Month Roadmap to 20%+ EBITDA Growth
”Where else can I cut?”
Hey there, fellow mortgage pros—I’m Matt Slonaker, and if you’ve been in this game as long as I have (three decades and counting), you know the ride never gets boring. I’ve led transformations at giants like JP Morgan Chase and Morgan Stanley, turning complex operations into profit powerhouses. Today, I’m excited to share a framework I’ve poured my experience into: a practical 6-month strategic roadmap to boost EBITDA by 20% or more in mortgage banks and loan servicers. This isn’t pie-in-the-sky theory; it’s battle-tested tactics drawn from real-world wins, designed to help you not just survive the current market but dominate it.
Let’s start with the reality check. The mortgage landscape in 2025 is brutal—rising interest rates have crushed refinance volumes by over 70%, origination margins are down 15-20%, regulatory compliance costs are up 22% year-over-year, and customer acquisition is hitting $8,500+ per funded loan. Legacy tech is dragging efficiency, and if you’re still relying on belt-tightening alone, you’re playing a losing game. I’ve seen it firsthand: pure cost-cutting erodes long-term stability. But here’s the good news—the Q2 2025 MBA Performance Report shows signs of recovery, with pre-tax net production profits flipping to $950 per loan from a $28 loss in Q1, and 80% of companies posting overall profits. It’s a fragile rebound, driven by seasonal purchase volume and cost management, but it underscores that adaptation works.
Before diving in, ask yourself: Are you ready for transformation? My executive self-assessment in the roadmap challenges you on five fronts—strategic vision, competitive edge, organizational agility, investment mindset, and urgency. Be brutally honest; it’s the foundation for unlocking sustainable growth.
At the core of this framework are the key EBITDA drivers: revenue levers like loan pricing and cross-selling, cost structures including origination expenses, operational metrics such as pull-through rates, and working capital optimizations. Start with a 2-week diagnostic—financial analysis to spot profit leaks, process mapping to flag redundancies, and tech assessments for quick ROI opportunities.
The real magic is in the 20% EBITDA Growth Framework, built on four pillars: Revenue Enhancement, Cost Reduction, Working Capital Management, and Tech Investment. Let’s break down the highlights.
On revenue: Ditch static “cost-plus” pricing for dynamic, risk-based models that factor in borrower data, market trends, and competition—unlocking 3-5% in gain-on-sale margins. Cross-sell ancillary products like insurance and home services; most banks capture less than 20% of this potential, but integrating them can boost non-interest income by 15% per loan. And retention? It’s 5-7x cheaper than acquisition—use analytics to spot at-risk customers and proactive outreach for 10% improvements in 90 days, yielding 3-4% annual EBITDA growth per 1% retained.
For cost reduction: Automate loan origination where 40% of tasks are manual—OCR for document verification cuts processing time by 65%, and e-closing platforms slash costs by $1,200-$1,800 per loan. Digitize customer service with self-service portals and AI chatbots to drop annual servicing costs from $250-300 per loan by 30-40%. Optimize your workforce (65-70% of ops costs) through capacity analysis and pod-based structures, reducing staff by 22% without hurting service.
Don’t overlook working capital—optimize warehouse lines to save 12-18 basis points, and use predictive analytics to minimize advances, freeing up $3-5M for a $100M monthly originator. Pair it with tech investments like RPA (ROI in 60-90 days) and advanced analytics for prepayment modeling, cutting portfolio runoff by 15-20%.
Implementation is key: Renegotiate vendors for 18-22% savings, restructure into centers of excellence for 15-20% productivity gains, and balance it all with risk management to avoid compliance pitfalls. Track progress with a real-time dashboard, and manage change through leadership alignment and accountability.
I’ve seen this work—a regional bank with $3.8B in originations hit 22% EBITDA growth in five months via dynamic pricing and automation, adding $1.8M quarterly. Another transformed servicing to cut costs by $115 per loan.
As Chief Lending or Servicing Officers, you’re the drivers here—optimize margins, reduce costs, and retain portfolios for massive ROI.
Rapid Self Diagnostic:
EBITDA Transformation Diagnostic Assessment
Introduction for Prospects:
Welcome to our Rapid Diagnostic Assessment on Maximizing EBITDA in Mortgage Banks & Loan Servicers. This 20-question multiple-choice tool, inspired by our 6-Month Strategic Roadmap, helps evaluate your organization’s readiness for 20%+ EBITDA growth through revenue enhancement, cost optimization, and operational efficiency. Answer honestly to identify strengths and opportunities. Each question has four options (A-D); select the one that best describes your current state. At the end, tally your score (A=1 point, B=2, C=3, D=4) for insights: 20-40 (Early Stage – Significant Gaps), 41-60 (Developing – Moderate Readiness), 61-80 (Advanced – Strong Foundation). Contact Sourcepoint for a customized debrief and partnership discussion.
Section 1: Foundation & Assessment (Questions 1-5)
- How aligned is your strategic vision for mortgage banking with disruptive innovation and bold EBITDA growth objectives?
A) Focused solely on maintaining current operations with minimal changes.
B) Includes some incremental improvements but lacks explicit targets for new revenue or efficiencies.
C) Targets new revenue streams and cost efficiencies, but not fully integrated into core strategy.
D) Genuinely geared toward market leadership with explicit, bold goals for disruptive innovation and 20%+ EBITDA growth. - To what extent do you understand your competitive advantages and vulnerabilities against fintechs and agile incumbents?
A) Limited awareness; we react passively to market shifts.
B) Basic understanding but no active exploitation of opportunities.
C) Moderate depth, with some identification of advantages but inconsistent action.
D) Deep understanding, actively identifying and exploiting opportunities to differentiate EBITDA performance. - How ready is your organization for significant change in pursuit of EBITDA transformation?
A) Low agility; team resists changes and lacks unified commitment.
B) Some resilience but struggles with internal resistance or short-term challenges.
C) Moderate agility and willingness, with partial leadership commitment.
D) High agility, resilience, and unified commitment to drive changes despite obstacles. - What is your mindset regarding investments in technology, talent, and initiatives for EBITDA growth?
A) Reluctant to invest; prefer to avoid reallocating from legacy operations.
B) Willing for small investments but lack robust ROI measurement.
C) Prepared for some bold investments with basic ROI tracking.
D) Fully prepared for necessary bold investments, with mechanisms to measure ROI and pivot quickly. - How well do you assess the urgency and market window for driving significant EBITDA growth?
A) Unaware of the limited window; no quantification of delay risks.
B) Basic grasp but inaction on competitive impacts.
C) Moderate understanding of risks, with some planning for timely action.
D) Fully grasp the window and quantifiable risks; decisive action to avoid long-term profitability erosion.
Section 2: The 20% EBITDA Growth Framework (Questions 6-12)
- What approach does your organization take to loan pricing models?
A) Static cost-plus pricing with no adjustments for market trends.
B) Basic adjustments but limited use of borrower data or competition analysis.
C) Some dynamic elements, achieving minor margin gains.
D) Fully dynamic, risk-based models factoring borrower data, trends, and competition for 3-5% margin gains. - How effective is your cross-selling of ancillary products like insurance or home services?
A) Minimal efforts; capture less than 10% of potential.
B) Basic integration but low conversion rates.
C) Moderate use of journey mapping, boosting non-interest income by 5-10%.
D) Advanced integration with propensity models, boosting non-interest income by 15%+ per loan. - What strategies do you employ for customer retention in your portfolio?
A) Reactive only; no proactive analytics or outreach.
B) Basic loyalty programs but limited impact.
C) Some analytics for at-risk identification, achieving 5% improvements.
D) Advanced analytics and proactive outreach, improving retention by 10% in 90 days (5-7x cheaper than acquisition). - To what degree have you automated processes in loan origination?
A) Mostly manual; over 60% of tasks require human intervention.
B) Basic automation for simple tasks, reducing time by 20-30%.
C) Moderate use of OCR and e-closing, saving $500-800 per loan.
D) Comprehensive automation (e.g., OCR, automated underwriting), cutting time by 65% and costs by $1,200-$1,800 per loan. - How digitized is your customer service for servicing operations?
A) Primarily phone-based with high manual handling.
B) Some self-service portals but low adoption.
C) AI chatbots for basic inquiries, reducing costs by 10-20%.
D) Full digital transformation with portals and AI, dropping servicing costs by 30-40% ($250-300 per loan savings). - What is your approach to workforce optimization and rightsizing?
A) No formal analysis; staffing based on historical norms.
B) Basic capacity reviews but minimal changes.
C) Pod-based structures with some productivity gains (10-15%).
D) Advanced analysis and variable staffing, reducing staff by 22% while maintaining service (65-70% of ops costs optimized). - How do you manage working capital, such as warehouse lines and cash conversion?
A) Basic management with no predictive tools.
B) Some optimizations but limited savings.
C) Moderate use of analytics, freeing $1-2M for mid-sized originators.
D) Advanced predictive analytics, saving 12-18 bps on lines and freeing $3-5M for $100M monthly originators.
Section 3: Implementation & Execution (Questions 13-16)
- How do you handle vendor management and contract optimization?
A) No regular reviews; accept standard terms.
B) Occasional renegotiations with minor savings.
C) SLA monitoring for top vendors, achieving 10-15% savings.
D) Comprehensive renegotiations and automation, yielding 18-22% savings in 60 days. - What is your organizational structure for operational efficiency?
A) Siloed departments with frequent handoffs.
B) Basic centralization but limited productivity gains.
C) Some centers of excellence, improving turnaround by 10-15%.
D) Full restructuring into centers of excellence, boosting productivity by 15-20%. - How do you prioritize technology investments for short-term ROI?
A) Ad-hoc investments with no ROI focus.
B) Basic evaluations but slow implementation.
C) Target some quick wins like RPA, with ROI in 90-120 days.
D) Strategic focus on high-ROI tech (e.g., RPA, analytics), achieving ROI in 60-90 days. - How balanced is your risk management and compliance in growth initiatives?
A) Compliance is reactive, often hindering growth.
B) Basic controls but frequent manual checks.
C) Some automation in QC, reducing samples by 20-30%.
D) Embedded automated controls and risk-based QC, balancing growth without exposure (40% smaller samples).
Section 4: Performance, Sustainment, Leadership & Next Steps (Questions 17-20)
- What performance tracking do you use for EBITDA metrics?
A) Monthly reports with limited real-time insights.
B) Basic dashboards but no drill-downs.
C) Real-time tracking for key metrics like margins and costs.
D) Comprehensive real-time dashboard with daily updates and drill-downs for 30% higher success rates. - How effective is your change management for transformation initiatives?
A) No formal framework; changes face high resistance.
B) Basic workshops but inconsistent engagement.
C) Stakeholder alignment with some training and accountability.
D) Full framework with vision alignment, cross-functional engagement, and tied compensation. - What role does your Chief Lending Officer play in EBITDA transformation?
A) Focused on day-to-day lending without strategic input.
B) Oversees basic margins and costs.
C) Manages pull-through and productivity with moderate gains.
D) Strategically optimizes pricing, automation, and sales for 3-5% margins and 20-30% cost reductions. - How prepared are you to take immediate next steps for an EBITDA initiative?
A) No action plan; waiting for market improvements.
B) Basic ideas but no dedicated team or timeline.
C) Formed a team with initial diagnostics in weeks 1-2.
D) Ready with a cross-functional team, launching vendor renegotiations and pricing optimizations immediately.
The critical question: Will you cling to survival mode or evolve to thrive? This roadmap is your path. If you’re ready, let’s connect for a tailor and unique diagnostic workshop. Drop me a line—together, we’ll rethink what’s possible.
Matt Slonaker
Revenue Growth Leader & Strategic Advisor
September 7, 2025
ps: a big bank Head of Lending texted me the other week after the workshop: “best and most valuable use of my time.” Guarantee you will get value as well!